Logistic Regression
Logistic regression as linear regression adapted to separate clusters with a line, or a curve, and how that boundary is learned.
- classification
- Logistic Regression in simple terms is an adaptation of Linear Regression to classify between clusters of data-points with a line (or a curve, i will speak more about how to get a curve later).
- The key differences made here are:
- , i (1, M) = {0, 1}
- Meaning for a , the label, will always be either 0 or 1.
- We still maintain the same hypothesis, , with a tiny change. After calculation of , we pass it though the Sigmoid function.
- Why sigmoid though?
Here is the graph of sigmoid:
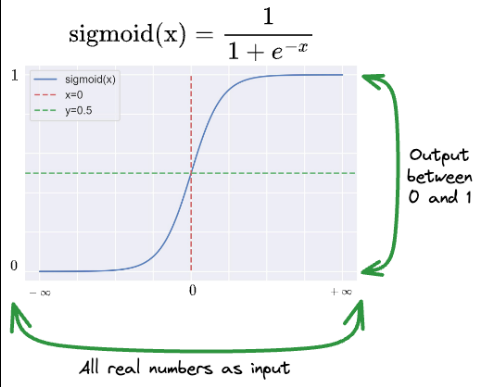
As we can see, it has all real numbers as domain, but its range is between 0 and 1.
This is valuable because, once we calculate , we pass it through the Sigmoid, This gives us the same in the range 0 to 1. Meaning, we can classify it as 0 if below, 0.5 and as 1 is above 0.5.
- Why sigmoid though?
- We use Negative log-likelihood for our error measurement.
- Likelihood gives us the same output, but we prefer to use log-likelihood as it is easier to differentiate.
- Likelihood function is given by the formula: . Where is the probability of Y being either 0 or 1, when given X, parametrized by , the Weights.
Converting the above into a mathematical if-else notation, we get:
Could you imagine differentiating this, would be an absolute pain with the chain rule. So we just take , which converts the to , because of 's property.
On simplifying the above:
Then we negate this, as we want to still retain the gradient descent algo, and not use gradient ascent instead.
- This is done because we want to maximize the likelihood that the data-point's guess is in the right side.
- This is done because we want to maximize the likelihood that the data-point's guess is in the right side.
Now, apply Gradient descent on this. Gradient descent because we once again end up with a concave graph between and all s. Which has only 1 minima.
- , i (1, M) = {0, 1}
- The basic idea is that we draw a line, of the formula type . Above was the detailed explanation on how to derive Weights matrix (W). Once we have the curve , we can put in new features of a data-point (X). Calculate Y with the calculated Weights(W). If we get a negative value of Y, then we classify it as 0, if we get a positive value of Y, we classify it as 1 with the help of the sigmoid function.
Here is an example of how the computer will solve a classification problem with Logistic Regression.#
- Here is our dataset:
- We make add on a column, with all 1s, because we want not just , we want a bias too.
- Then we make a Weights matrix, with (N,) dimension. And they could be randomly initialized to a number, but for simplicity i took it as all 0s.
- After applying Gradient descent. We could get out weights matrix as: (I made these values up, do not fact check the weights)
Now lets see why this can classify above points
- On using first training example as input:
- Since Y > 0.5, we classify it as 1. Which is exactly what the label of the training example is.
- Now lets try the 3rd training example:
- Since Y<0.5, we classify it as 0. Which is the label of that training example.
- On using first training example as input:
Introducing curves using Linear models:#
We could also have a curve as our decision boundary by using simple math. If we had a singular feature:
- Where the superscript mentions the training example number and the subscript mentions the feature number And on observing the graph between and , we clearly observe that the decision boundary is a quadratic of the form:
- Then we could tackle this very easily: We could introduce another feature
where:
-
and so on...
Now we could treat this as the new dataset and work on it with all the previous steps.